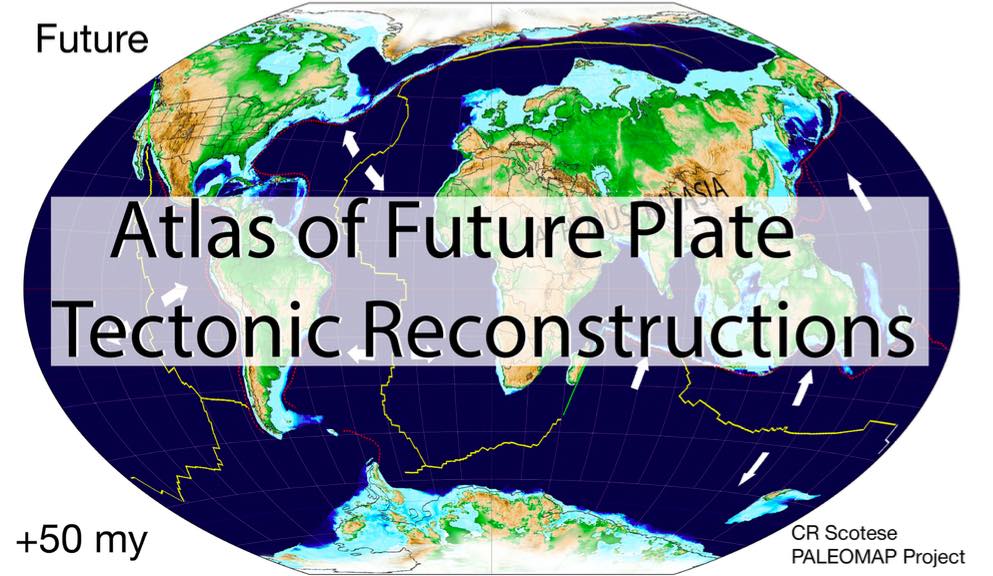
Atlas of Future Plate Tectonic Reconstructions: Modern World to Pangea Proxima (+250 Ma)
by
Christopher R. Scotese
March 1, 2018
An animated version of the maps can be viewed on YouTube at: https://www.youtube.com/watch?v=qrtl8oMn-U8
Introduction
In 1982, when I was a graduate student, I was asked by Discover magazine to produce a set of maps showing future plate motions (Overbye, 1982). I replied that I thought that I could make a reasonable extrapolation of current plate motions 50 million years into the future. However, that was not sufficient. The magazine wanted maps for 50 million, 150 million and 250 million years in the future! I thought about it for a few seconds, and then decided to give it a try.
I realized that simply projecting current plate motions 150 million or 250 million years into the future would not work. Too much can change during that length of time. In order to solve the problem of future plate motions I was required to ask some serious questions about plate dynamics. What drives the plates? Why do they move they way they do? These are important questions for anyone that makes plate tectonic reconstructions. We cannot make maps of the distant future, or the distant past
for that matter, unless we have a clear idea of the driving mechanisms of plate tectonics.
During the intervening years, I have come to realize that plates are driven by lithospheric forces, primarily “slab pull” and “ridge push” (Scotese, 1993, 2017, see Appendix I). Slab pull is the “tug” that plates receive from the subducting oceanic lithosphere. Ridge push is the “push” plates receive from the elevated mid-ocean ridges. This elevation imparts a gravitational “push” much like the push a skier receives going down a ski slope. The first set of maps imperfectly used these plate dynamics to propose where the plates might go in the future.
I published a second generation of future maps in the Atlas of Earth History (Scotese, 2001). This set of maps corrected a major mistake that I made in the first set of maps. It is common wisdom that the rifts of East Africa represent the first stage in the formation of a new ocean. While it is true that all intracontinental ocean basins begin their life as a continental rift, it is not true that all continental rifts form ocean basins. Some rifts are aborted or “failed” rifts. Sadly, the East African Rift system is one of these failures. The principal reason that a new ocean
will not open is that as Africa continues to drive northward towards Eurasia the East African Rift (and also the Red Sea and Gulf of Aden) will be caught up in that massive collision and the young, thin ocean floor will be squeezed shut.
The maps presented here represent my third attempt at predicting future plate motions. I finished these maps in 2004 and added plate boundaries in 2005.
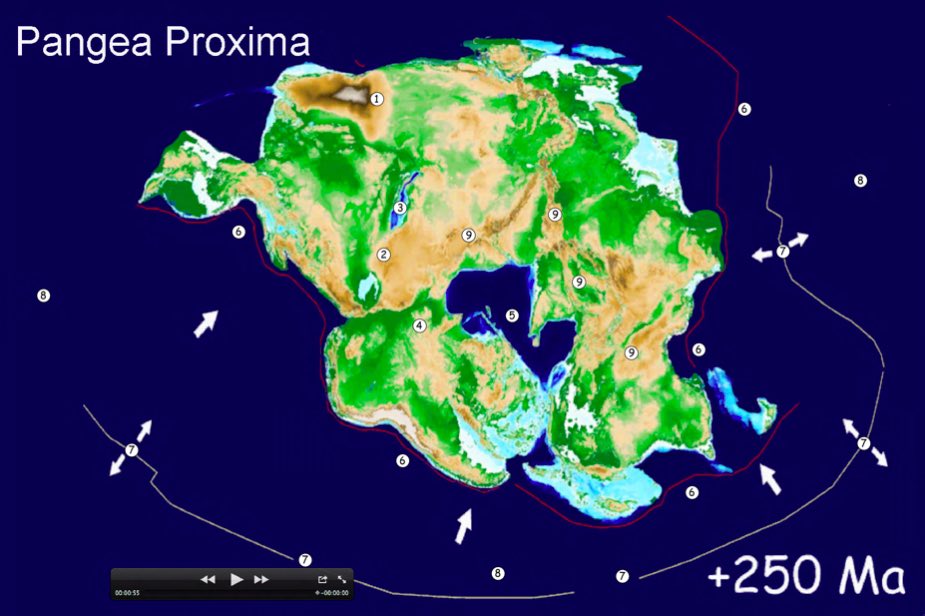
In addition to maps for +50 million years, +150 million years, and +250 million years, I added eight additional maps representing plate configurations at 25 million year intervals into the future. Also, I changed the name of the supercontinent that appears at +250 million years from “Pangea Ultima” (which sounded awfully final) to “Pangea Proxima” (the next Pangea)
For the last 15 years the maps have mostly sat on my shelf because though they are informed speculation, they are not science. We can never really know what the future holds. However, because of the renewed interest in future plate tectonic scenarios (Battersby, 2017), I decided to provide a more detailed outline of my thought processes when I drew these maps. I think you will enjoy this speculative story of the
future wandering of our continents. The final version of the maps will appear in my book, “Earth History: The Evolution of the Earth System”, which I hope to finish in a few years.
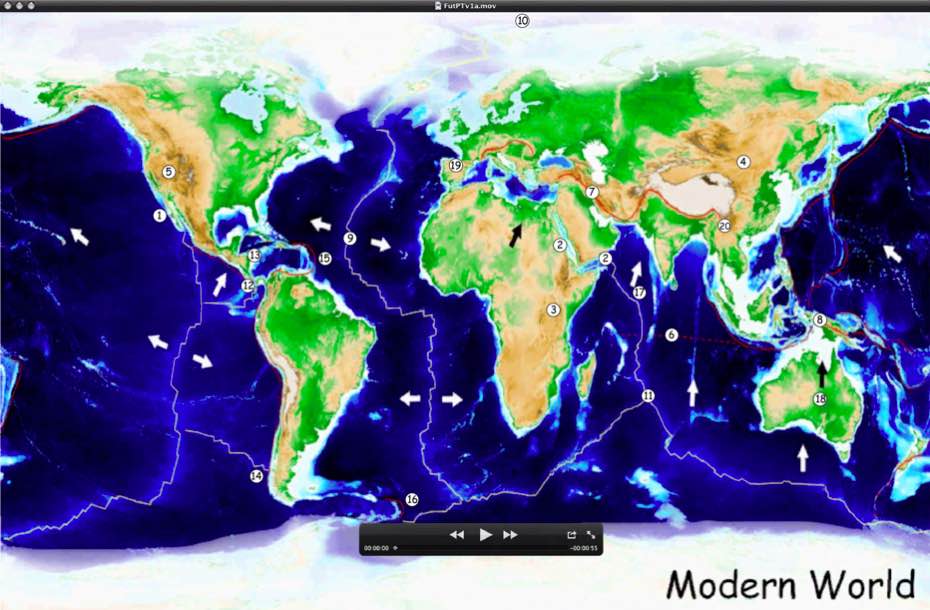
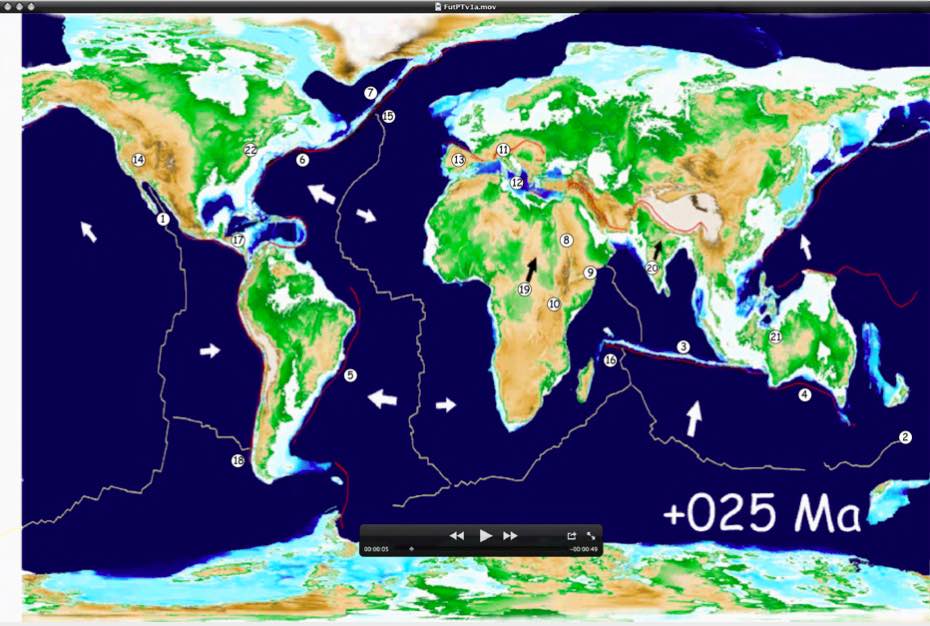
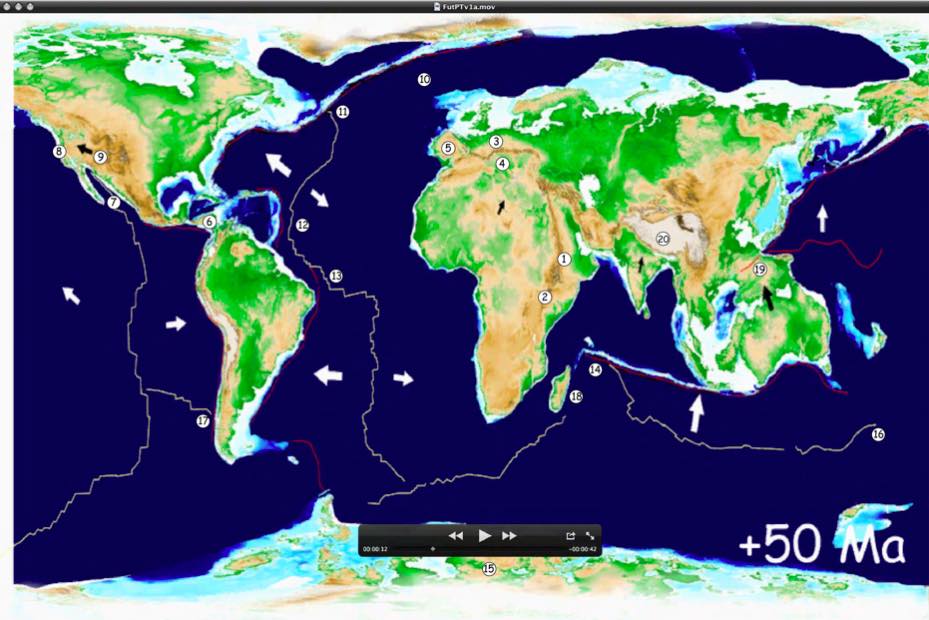
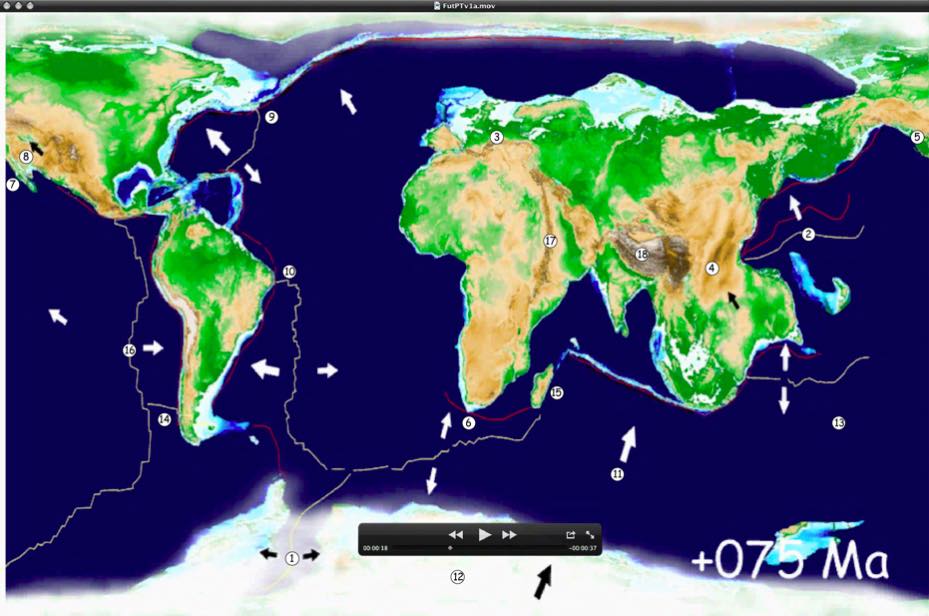
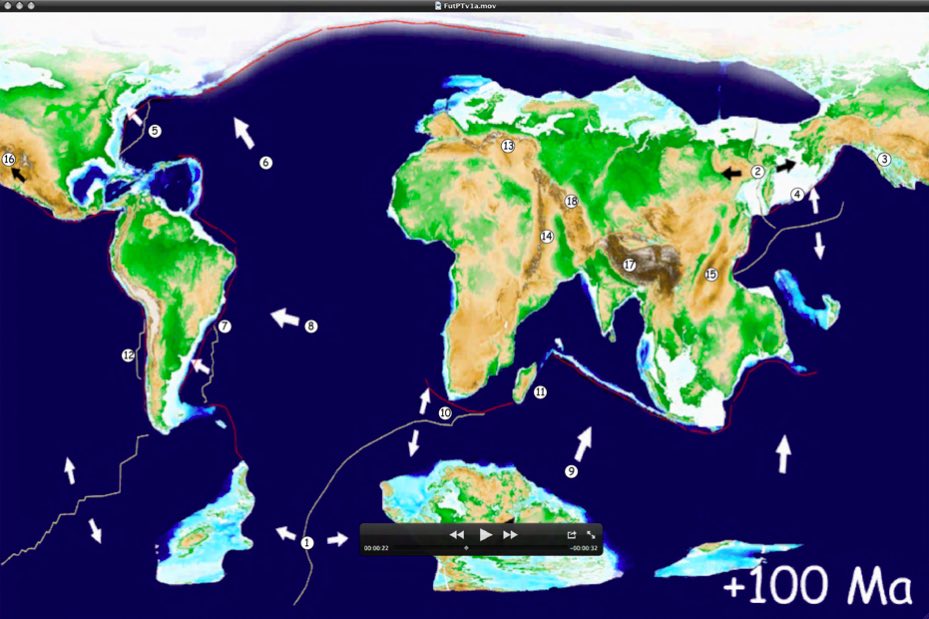
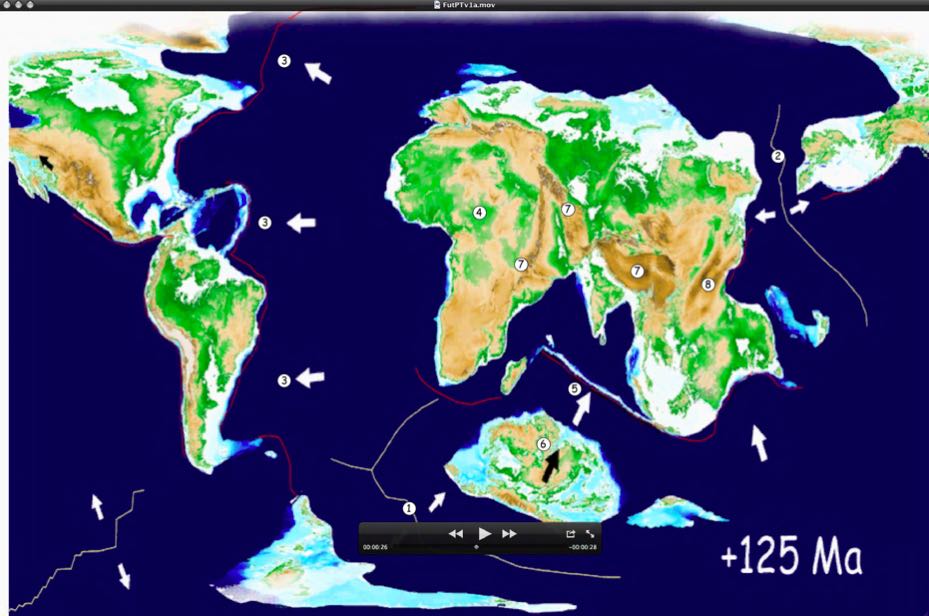
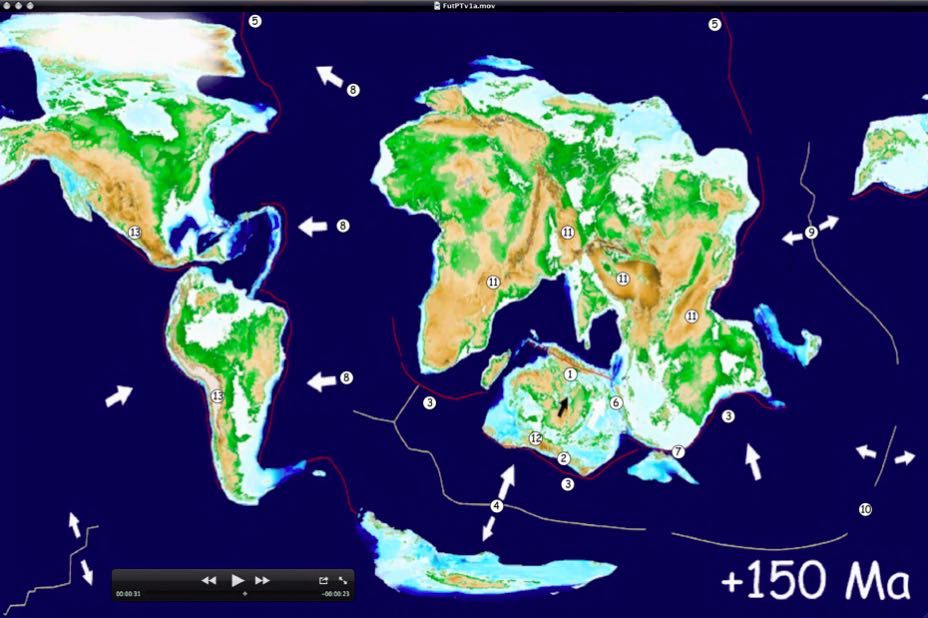
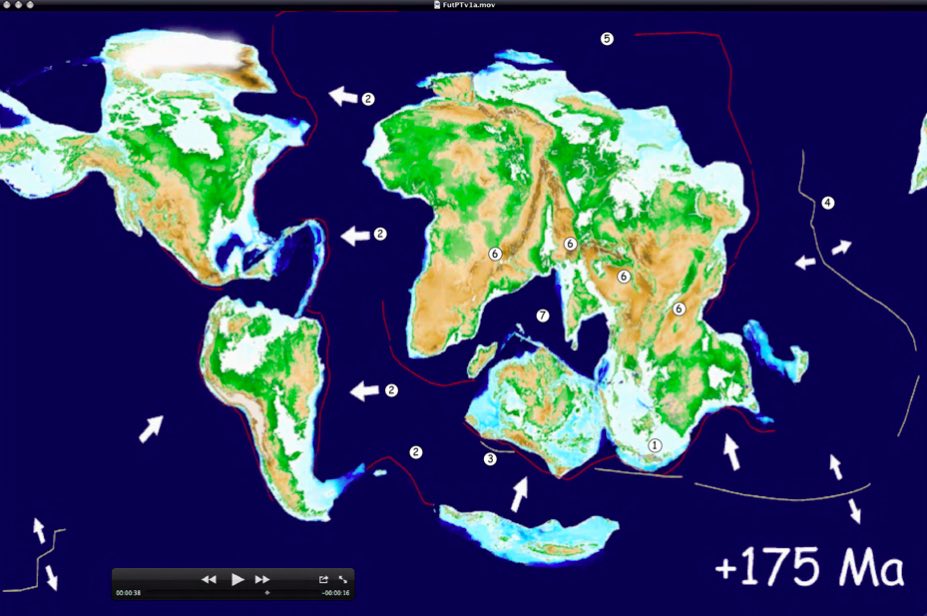
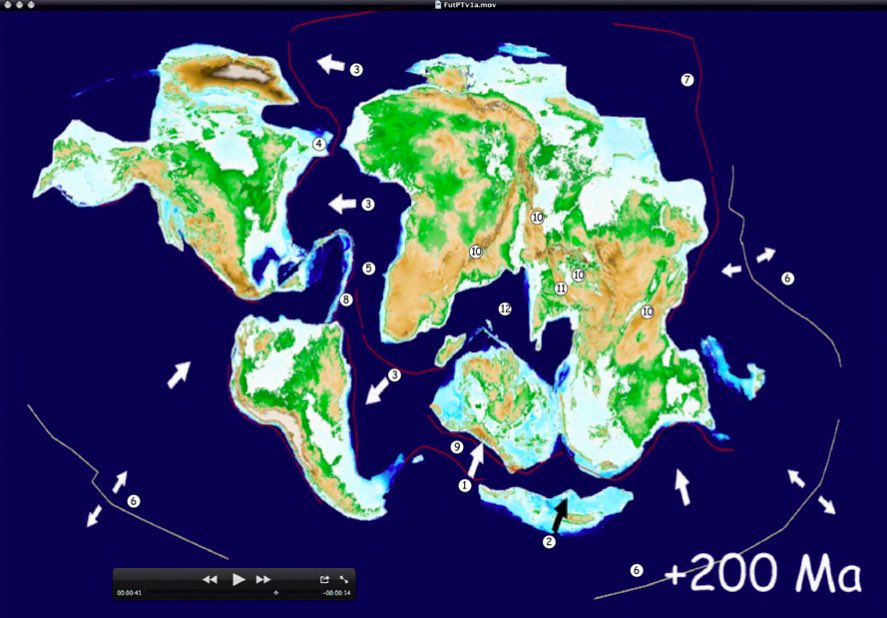
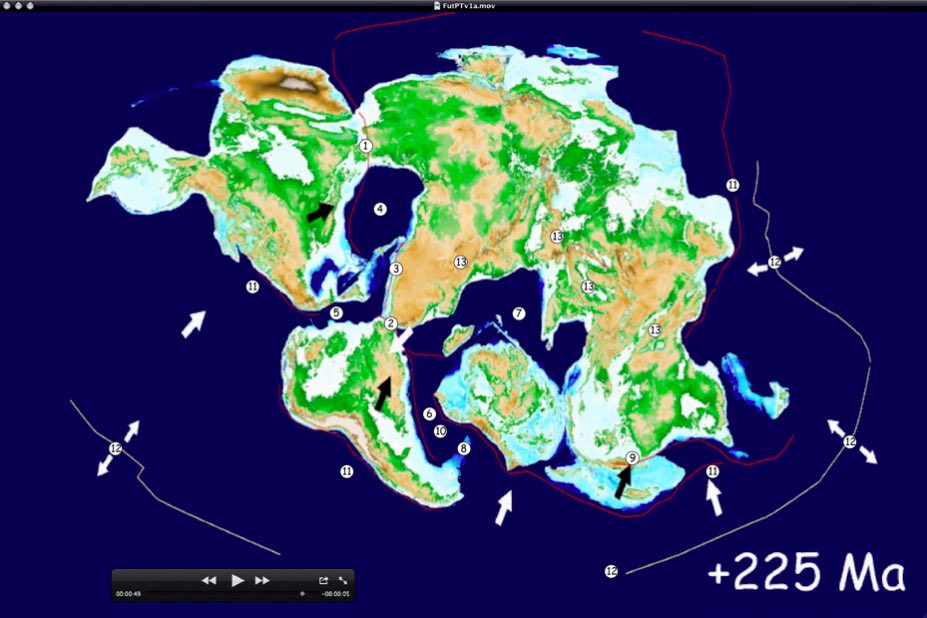
The following section is made up of ten future plate tectonic reconstructions, each with an extended figure caption that describes the major plate tectonic features and events. The numbers in the figure caption refer to the circled numbers on each map. Yellow lines are mid-ocean ridges. Red lines are subduction zones. White arrows indicate the direction of plate motion. A set of maps without the numbers can be found Appendix II of this report.
In addition to a summary of important plate tectonic events, I have included a description of important geographic changes, e.g. new mountains or seas, and have estimated the global climate (i.e., icehouse, greenhouse or hothouse) and mean global temperature based on a climate model that I have applied to ancient times (Scotese, 2016).
Map 1. Modern World Plate Tectonics
New (Young) Mid-Ocean Ridges: Gulf of California (1), Red Sea and Gulf of Aden (2).
New (Young) Continental Rifts: East African Rift Zone (3), Lake Baikal (4), Basin & Range (Western USA) (5)
New Subduction Zones: the Capricorn subduction zone (6) in Central Indian Ocean
New Collisions: Arabia with Iran (Zagros Mts.) (7), Australia with Indonesia (Highlands of New Guinea) (8).
Continuing Plate Tectonic Processes: The Atlantic (9), Arctic (Eurasian Basin)(10) and Indian (11) Oceans continue to widen. The Pacific Ocean contracts slightly. Cocos-Nazca mid-ocean ridge (12) is subducted beneath Panama. Honduras (13) slides eastward as the Caribbean plate lengthens (E-W). Chile Ridge (14) subducts beneath southwestern South America. Subduction continues around Pacific “Ring of Fire”. Westward-directed subduction occurs beneath the Puerto Rican (15) and the Scotia
(16)arcs. Africa (17) and India/Australia (18) continue to move northward towards Eurasia.
Geography
High mountains run E-W across Eurasia (19) from the Pyrenees to the Burmese Ranges (20). Andean- type mountains rim the Pacific Ring of Fire.
Climate
Warming, bi-polar Ice House. Global Temperature 15 ̊C

